
18 May TradeVisor Review: Optimize the Three Ps of the Trade Sequence
https://www.priceseries.com/tradevisor_review_jea.html
Overview
TradeVisorâ„¢ is a powerful subscription-based algorithmic stock research and portfolio management platform available at priceseries.com. Founded by Rajesh Srivastava, an engineer and trader with over 25 years experience in Silicon Valley serving at firms ranging from Hewlett Packard, Symantec, and Intel Security/McAfee has applied his extensive technical background in developing this algorithmic platform. Sophisticated machine intelligence algorithms scour US equities markets to identify, monitor and track the best stocks to trade. For most traders it is simple enough to understand right “out of the boxâ€. The training videos take about 15-minutes to acclimate to the platform. TradeVisor provides analytics and adjustable parameters to help narrow the filtering to meet specific criteria. This is an end-of-day product that updates alerts after the market close by 7 pm EST. This is great for swing traders as well as day traders looking for set-ups to play the next day.
Power and Simplicity
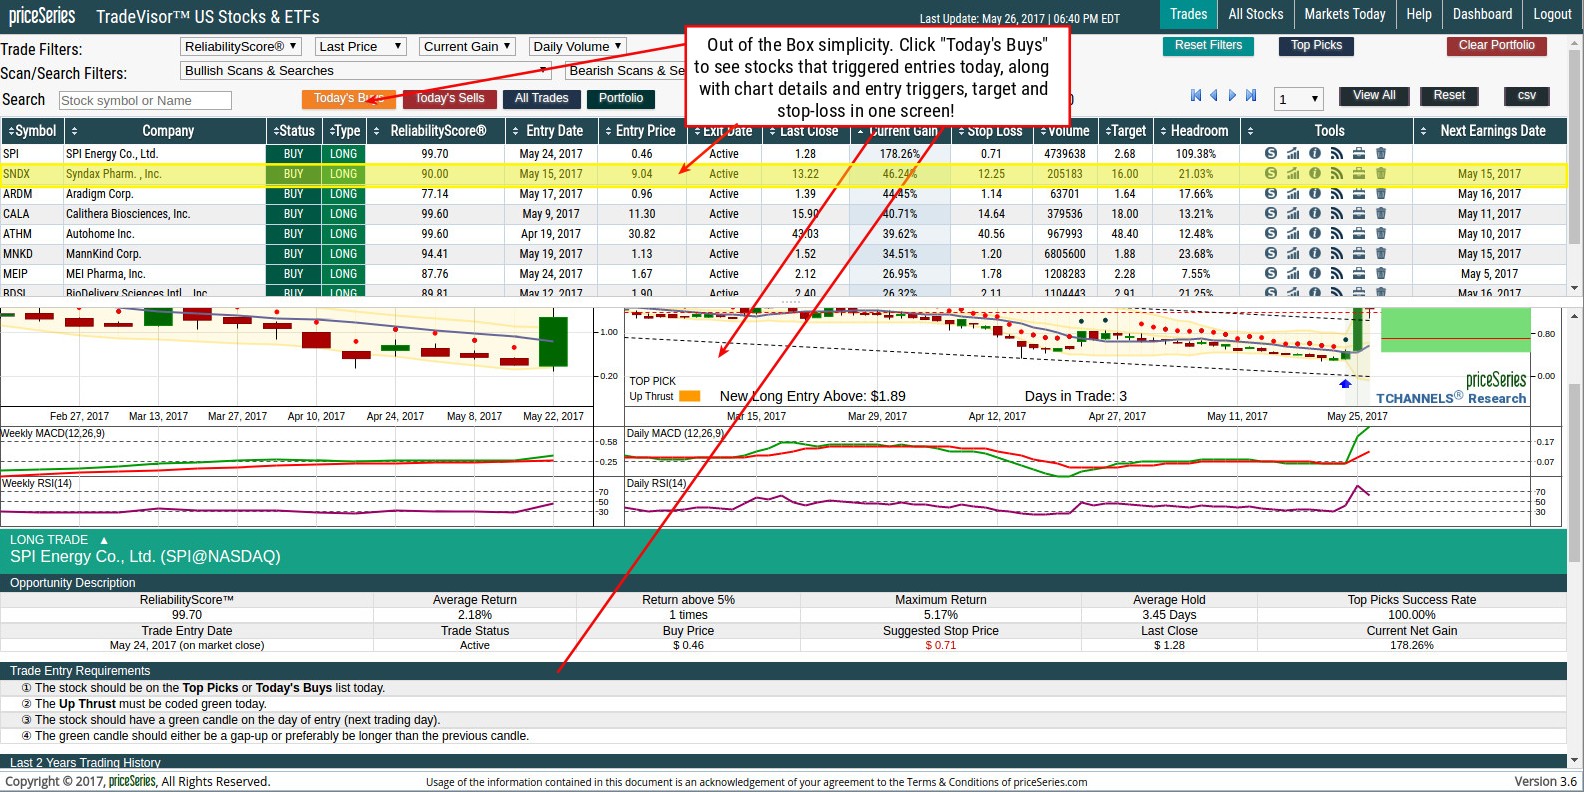
The front-end simplicity powered by robust search and analytic algorithms under the hood make this an excellent stock selection platform for traders and investors alike. I like how it puts the alerts out there with suggested buy, sell and stop price levels. Unlike other platforms on the market that are ambiguous and require users to learn an extensive list of terms and convoluted ratios, this platform is direct and cuts out the fluff. I like that. It is simple enough for anyone to log into this web-based platform and immediate understand the alerts and follow the in-trade stocks, or consider the new trade alerts for that day. The alerts can be clicked and sorted by categories.
Stock/ETF Scanner
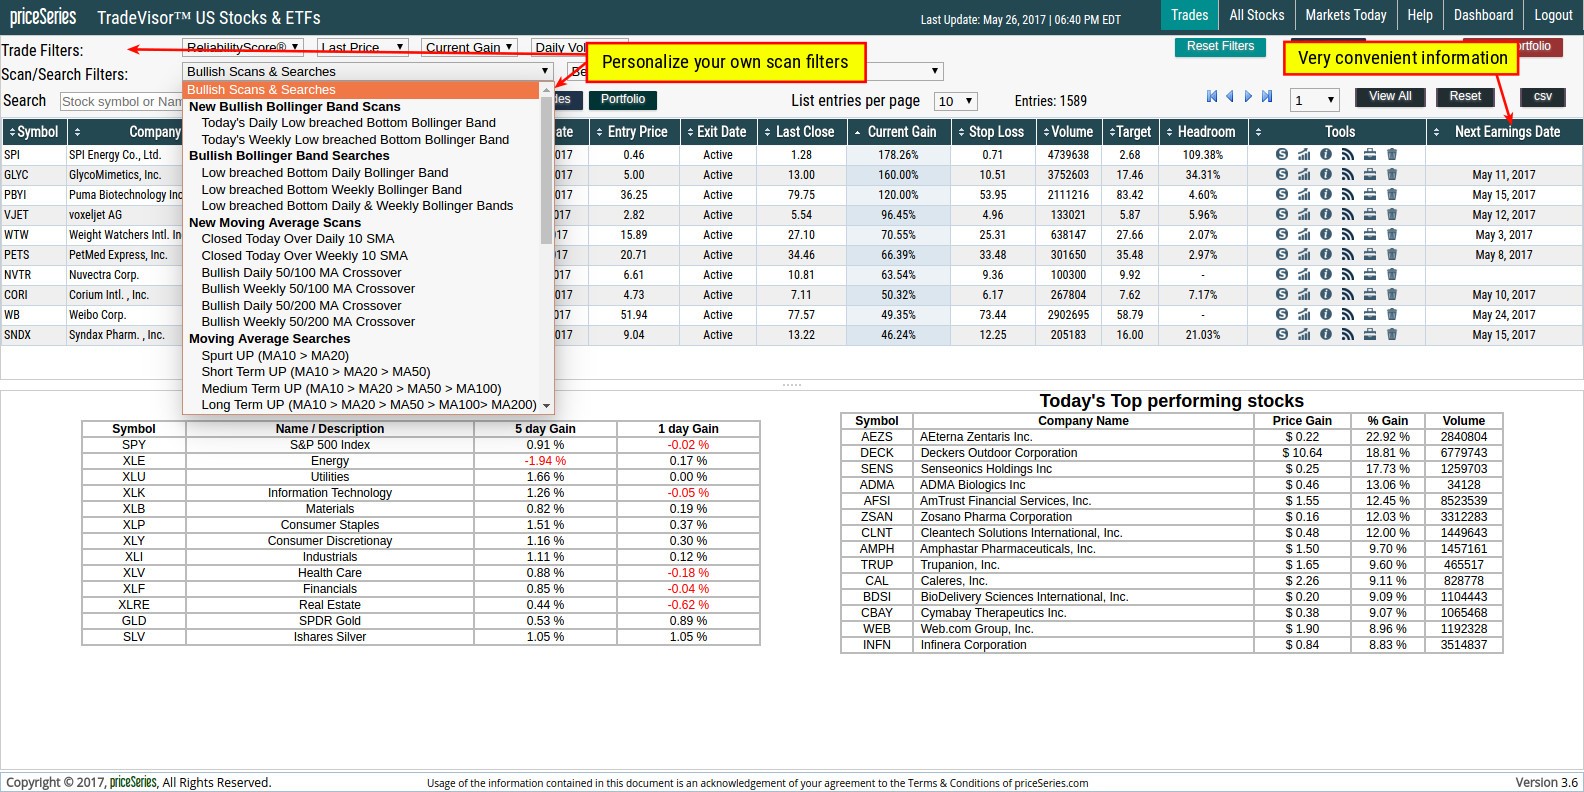
TradeVisor™ provides two level filters that can be used alone or combined for more selectivity. The first level filter is based on attributes including ReliabilityScore® (the higher the better), Last Price (price range of stock/ETF), Current Gain and Daily Volume. The second level filter is based on technical analysis-based conditions with a bullish/bearish theme including Bollinger Bands, MACD, RSI and Moving Average Crossovers patterns. Combining the first level filter with the second level filters provide a nice watch list of stocks to monitor.
Charts
TradeVisorâ„¢ provides two quick charts including the weekly and daily with detailed moving average support and resistance levels, buy/sell triggers, target ranges, MACD and RSI momentum readings and trade stats. It also provides the two-year back-tested historical signal performance details.
The Tools Column
There are a number of robust features on the TradeVisor platform. Users should make sure to utilize the Tools column with the menu of icons just below to truly maximize the platform. There are six icons under the Tools column. Here’s a rundown of each one icon from left to right:

Stock: This is the first icon with the “S†which indicates a stock. Icon with "E" indicates an ETF. Clicking the row will pull up a quick summary of the technicals including a weekly and daily chart with indicators including support/resistance trend lines, target price ranges and two momentum oscillators MACD and RSI. The status of the stock whether it is currently an active trade is indicated under the charts. Opportunity Description provides useful stats on the trade including suggested Buy, Target and Stop-Loss price levels. The Trade Entry Requirements lists the criteria for triggering the trade. The Last 2 Years Trading History provides the history of signals generated on the underlying stock including Entry, Exit price and date with Net Gain percentages.
Charts: This icon opens a powerful pop-up chart powered by TradingView. These flexible charts can be configured by time frame, type of chart and comparison option. Clicking the Indicator chart icon opens up an expansive menu of indicators including moving averages to momentum oscillators, Bollinger Bands, various money flow and volume-based oscillators and pivot points.

Info: The lower case “i†icon opens an information window that provides a fundamental analysis snapshot of the stock including an adjustable price chart, stock price stats, recent trade trigger details and company information.
News: This radio waves icon opens a window with news headlines specific to the equity, pulled from YAHOO! Finance with links to access the full articles.
Briefcase: Clicking the briefcase icon triggers a pop-up that asks if you want to ADD the stock symbol to the Portfolio. Selecting OK will place it in the Portfolio, which can be accessed by clicking the “Portfolio†button (next to “All Trades†button). This is your personal Portfolio list, which allows you to segment specific stocks to follow.
Trash Can: Clicking the trash can icon will remove the stock from your portfolio.
The 3 Ps of a Trade Sequence
Before we delve into the platform, let’s first get on the same page in regards to the purpose of a platform. A trader must always consider what process exactly ensures a successful trade? This can be answered with the three Ps: Procure, Plan and Play. These are the three steps every trader needs to complete to ensure the best probabilities to profit on each trade. Each of these steps involves legwork on behalf of the trader. The experience of the trader will determine how thoroughly and quickly the steps are completed. Assuming you have a solid trading methodology, the three steps should be a fairly methodical process. Personally, it takes me a good 60-90 minutes every morning to derive a solid watch-list to trade. It can be time consuming and takes effort every morning or evening to follow-through. However, the reciprocal nature of the markets rewards you for the effort you put in. Let’s review the three steps:
Step 1: Procure a stock: You need to find trade-able stocks to… trade. This involves scanning for technical patterns, news-based gaps, sector/peer sympathy movement with parameters like minimum daily volume to insure liquidity and minimize slippage and price range. Once a stock fits your parameters and strategy, then move on to the next step.
Step 2: Plan the trade: This involves determining the trend, the support and resistance levels and relative market sentiment. By understanding where these price levels are, you can then plan your entry area, target area(s) and stop-loss levels. Once you determine these levels, then you can determine how much your position size will be. Too many traders have this backwards and jump in with a large position before measuring the price levels. Remember, that risk is basically exposure. Exposure is based on the size of the position and holding time. Remember that larger position sizes incur more risk as does longer holding periods. Therefore, you offset some risk; you can take a smaller position to holder longer or a larger position to hold for a shorter period of time. The other factor is probability. How strong is the pattern set-up or strategy? Have you back-tested it? Once you have determined the plan, then move on to the next step.
Step 3: Play the trade: This is executing the game plan. You can scale into your position with multiple trades at differing price levels to get a better average price, or take it in one trade to avoid commissions. Once you are in the trade, you have to monitor it and actively trim or add based on the price action. The goal of any trade is to ultimately eliminate risk, which means cutting the exposure to zero by exiting the position. Whether this results in a net profit or loss will often depend on the first two steps. Remember, just because you took a loss, doesn’t mean it’s a bad thing. Stop losses are part of the game and prevent your account from getting blown out. Most traders tend to forget this fact and shun taking stop-losses and leave their fate to the markets. Unfortunately, they can become bag-holders rather quickly. Rinse and repeat the three Ps.
Each of these components makes a material impact on the outcome of any trade. The best way to measure the utility of a platform is how well it helps you with the three Ps. Does the platform effective contribute to taking some of the legwork out of each of the three Ps? No trader should rely solely on a platform to handle all three Ps. Instead, a solid platform will assist tremendously and contribute to the bottom line in doing so. Remember, you still need to have your own methodology or trading system in place. The best platforms will assist to all three steps.
As with any stock selection platform, the user should only take the picks as a suggestion and make sure to run it through their own methodology to validate their own criteria for the trade before building a position.
Measuring TradeVisorâ„¢ Against the Three Ps
Let's see how TradeVisorâ„¢ measures up with the three Ps. First off, the most important function for me is the first step; to procure potential stocks. The lifeblood of any trading system or portfolio is the steady flow of fertile trading opportunities. Manually searching and filtering for stocks takes the most time and legwork to complete. This is where TradeVisorâ„¢ is worth its weight in gold. It provides an endless flow of potential stocks that have already been filtered and vetted to consider trading. The user can cherry pick the suggestions that are familiar or those that fit personal criteria the best. The platform has a scanner that you can plug in your own parameters to discover additional candidates. TradeVisorâ„¢ more than fulfills the procure step.

The preparation stage requires determining trend, support and resistance levels. TradeVisorâ„¢ supplies the information with every stock selection. Just by clicking on the stock, a chart with the aforementioned is immediately displayed with suggested entry, targets and stop loss suggestions. From here, you can easily determine how much of your capital you wish to allocate to the particular trade, knowing what the risk/reward is ahead of time. There is a convenient back-test function as well to let you test out historical performance. TradeVisorâ„¢ thoroughly assists with helping your preparation on any selected stock.
Lastly, you are ready to play the trade. This means taking prudent entries, monitoring the trade and having exits ready, be they exits on profit targets or stop losses. Newbies may still have a tough time pulling the trigger, or even recognizing triggers on their own. That’s why TradeVisor™ provides a checklist of triggers under the “Trade Entry Requirements†section. These are the same instructions for triggering the algorithmic trade entry. The platform will alert when these levels have been hit and the trade is updated on the platform. Personally, I like to use these levels as a reference point when trading intra-day. TradeVisor™ really helps with the final step of the trade sequence.
The goal here is to utilize the platform to find ideas and opportunities that you can adopt. It’s like having a dew trading assistants scanning and filtering the market to provide you with the freshest ingredients to prep, like a chef. You prepare the ingredients for consumption. It all starts with procuring the finest high quality ingredients. This is the strongest factor for TradeVisor™. There is also a very small learning curve to get acclimated to the program, unlike other platforms that require you literally memorize a whole new language to understand their convoluted terminology.
Pricing Options
Once again, this is so refreshing. They offer a free two-week, no obligation trial to kick the tires. No credit card required. It’s a testament to the confidence in the company’s product. The monthly fee is $50 a month on a recurring basis. No add-ons, no gimmicks, no endless spam e-mail pitches and phone calls. There are no hidden add-on modules or fine print or exchange fees that convolute and distort the pricing as found on so many other platforms on the market. They don’t try to pitch you to attend live seminars to get sold more products like VectorVest. Speaking of which, here’s a quick comparison.
TradeVisorâ„¢ Versus VectorVest
First off, the biggest turn-off for me when evaluating VectorVest is the non-stop sales pitch spamming you will receive after signing up for the trial, which can cost up to $9.95. Be forewarned that there are endless “add-on modules†that they will try to sell you. Who wants to be subjected to a barrage of sales pitches by e-mail, platform, snail mail and phone? Talk about confusing pricing options. Here’s a rundown of prices so far that are listed on the site:
VectorVest offers $9.95 trial periods ranging from 30-days for the RealTime plan to five-week trials for the End of Day and IntraDay plans. Exchange fees are additional for the RealTime plan. The plans resume normal pricing after the trial period which ranges from $69 a month for end-of-day tools, $89 a month for 15-minute delayed tools and $129 a month for real-time analysis and market timing tools. Discounted pre-payment plans are available at $695, $895 and $1,295 for the EOD, IntraDay and RealTime plans. There are also additional Plug-In Modules that range from $99 per month like RoboTrader and RealTime Derby to $495 one-time fee modules including Options Analyzer, OptionsPro and AutoTimer.
As for the platform, you are only getting the basic platform with the basic subscription. VectorVest literally has their own language of made-up ratios that are used to filter stocks including: RS (relative safety), RT (relative timing), RV (relative value). The main one is the VST (Value, Safety, Timing), which is ValueVest’s way of rating the best stocks to buy. They also have a gimmicky Market-Timing gauge that indicates bearish or bullish conditions, as if it would know until after the fact. Personally, I can’t stand these types of gimmicks (traffic lights, gauges, meters, etc) that offer no foresight but indulge in laggard reads on the market, courtesy of Captain Obvious.
Users can sort through the tracking list of stocks to find candidates based on the various metrics and rankings. Once you find some stocks of interest, you can then select from even more strategies to apply, be aware that you have to buy more add-on modules to get the full range of ‘strategies’. Each of the trading strategies come with a generic step-by-step “Daily Action Plan†where they provide a menu of stocks and the game-plan to trade them. This is really generic stuff and frankly users have to be pretty lazy or uneducated not to already perform these steps on their own. Also, I have found many of their VST top picks are extremely volatile thin-liquidity “flavor of the day†momentum stocks that newbies should steer clear away from. Liquidity can vaporize on these, leaving many bag-holders when the smoke clears. It makes me wonder where the S as in “safety†is with the VST metric. I guess it’s not possible to monitor when churning through over 20,000 stocks in their scans. They market to newbies, but it takes a seasoned trader to truly decipher the picks.
Substance Versus Fluff
A convoluted platform equates to extra legwork to validate the stocks that were supposedly filtered through over 40 “proprietary†indicators, as if that means anything. The non-stop marketing and cheesy commercials that selectively point out their triple digit gainers is stomach turning for me. They are a marketing machine that constantly dangles a carrot to newbies to get them to purchase more add-ons. In the backdrop of these types of platforms, TradeVisor™ is a breath of fresh air, a straightforward out-of the-box streamlined, powerful yet simple platform, without all the supposed “bells and whistles†gimmicks and endless sales pitches. Assuming the user has a reliable trading methodology, the platform performs much of the legwork in finding viable stocks to consider.
One Man’s Flaw is Another Man’s Edge
The market is a cannibalistic entity that relentlessly seeks to exploit your maladies: ignorance, desperation, impulsiveness, fear/greed, complacency, arrogance and laziness. One man’s flaw is another man’s edge, right?
Every participant can relate to each of these flaws. They are a constant ‘work in progress’. Ironically, many of these maladies can form from winning, not just losing. They are triggered when traders are pitted in certain situations and trading conditions. They are situation-based conditions that can completely envelope a trader’s persona and psyche. The underbelly of the markets has a lining that engages reciprocity, the more effort you expend, the more return you receive (not always in cash). This applies literally to all endeavors. In professional boxing, champions understand every minute in the ring requires a minimum of 1,000 minutes of training. This is enduring effort.
Augment Not Replace
In trading, I have found that the effort is not measured by the volume of trades, but in the preparation process of the procuring and planning phases of the trade sequence. It is in the first two Ps, where the most effort needs to be piped in. This is where a solid platform will help you the most. The platform should assist in streamlining some of the legwork, thereby optimizing your time and effort to generate a additional robust source of valid ideas, stocks ready to move. If a platform can do that, then it’s worthy. Within that context, TradeVisor™ fits the bill. Keep in mind, this doesn’t mean you don’t need to have a foundation of knowledge and trading skill-sets. It will simply enhance the preparation process to derive more fruitful opportunities with fertile stocks to trade.
Can’t Fake It
Traders or investors who expect to rely solely and completely on a scanner/research platform should really consider hiring a portfolio manager or investing in mutual funds. The goal is to streamline the effort, not to eliminate it. Because once the effort is gone, the market no longer reciprocates. Too many traders try to wing it and take shortcuts only to get devoured like a deer in the headlights.
To sum it up, TradeVisor™ addresses the three Ps of the trade sequence with flying colors. A stock market scan/research platform’s sole purpose is to alleviate much of the legwork and optimize the efforts in the preparation process to produce viable, filtered stocks that are ripe for opportunity. It is to augment, not replace a trader’s efforts and methodology. The trader can ‘adopt’ the ideas and run with them. With that said, I highly recommend giving TraderVisor a try. They offer a no-obligation, no-risk and no credit card required free trial at www.priceseries.com
I give TradeVisorâ„¢ through priceseries.com 5 stars ( ) for value, utility and simplicity.
Pros:
- Powerful algorithmic search and analytic engine finds stocks to play
- End-of-day update with alerts is great for swing and intra-day traders
- Simple out-of the-box design let’s users learn system in 15-minutes
- Customized scanner with two level mix and match options
- Cloud-based platform accessible on any device anywhere
- Free 2 week trial to test complete platform with no credit card needed
- Amazingly cheap at only $50 per month no exchange fees
- No upsell, spam, marketing bait-n-switch add-ins
Cons:
- No intra-day scanner (for now)